Data Visualization
Gathering personal data and telling a story of how our daily habits affect the environment through data visualization.
Duration: 3 weeks
Context: Part of college module (Year 2)

Showcase the sheer volume of Amazon orders placed in our household over one year
Online shopping is convenient and creates an illusion of being clean - detaching us from the environmental luggage carried by each purchase.
Data collected
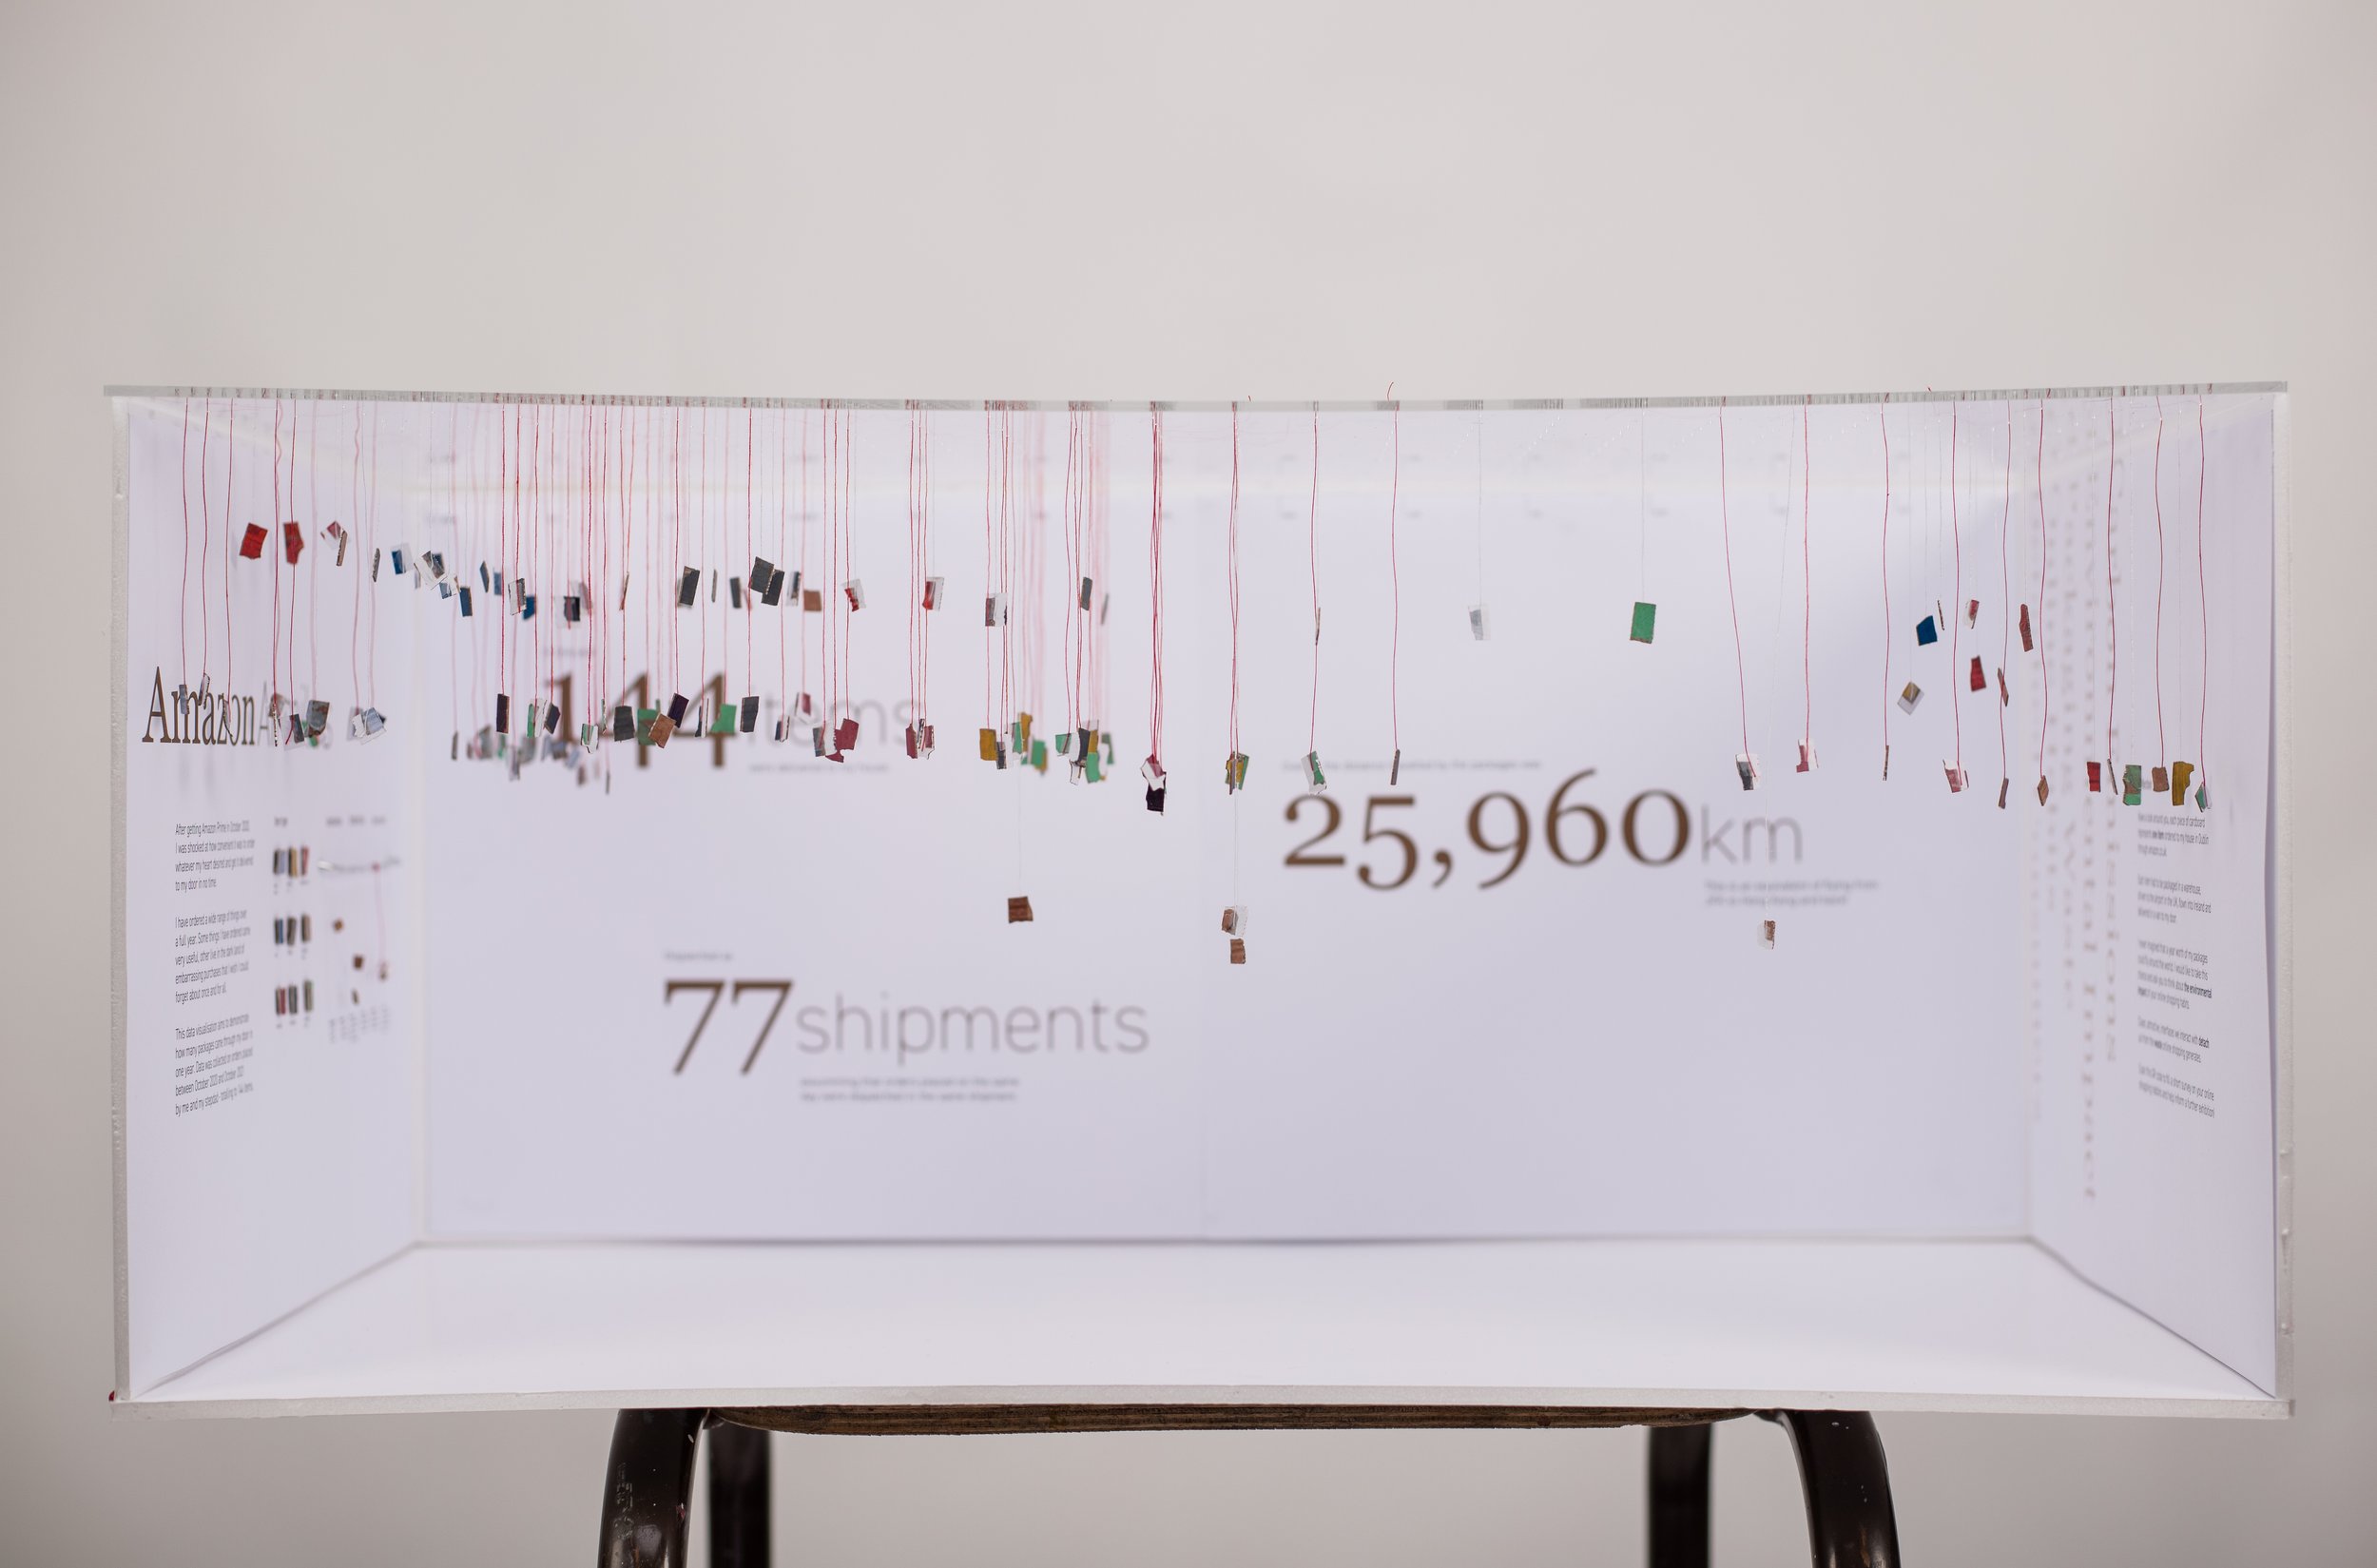
In one year, 144 items were ordered from Amazon either by me or my step-dad.
That is equivalent of one item arriving every 2-3 days.

Deciding to showcase data in a 3D environment - surrounding the viewer with flying pieces of cardboard (packages).

Getting the feel for how audiences might interact with physical objects suspended around them.
Exhibition Scale Model

Legend / Key in relief, explaining different dimensions of data presented

3 wall room with typographic panels and data points (parcels) hanged from the ceilling
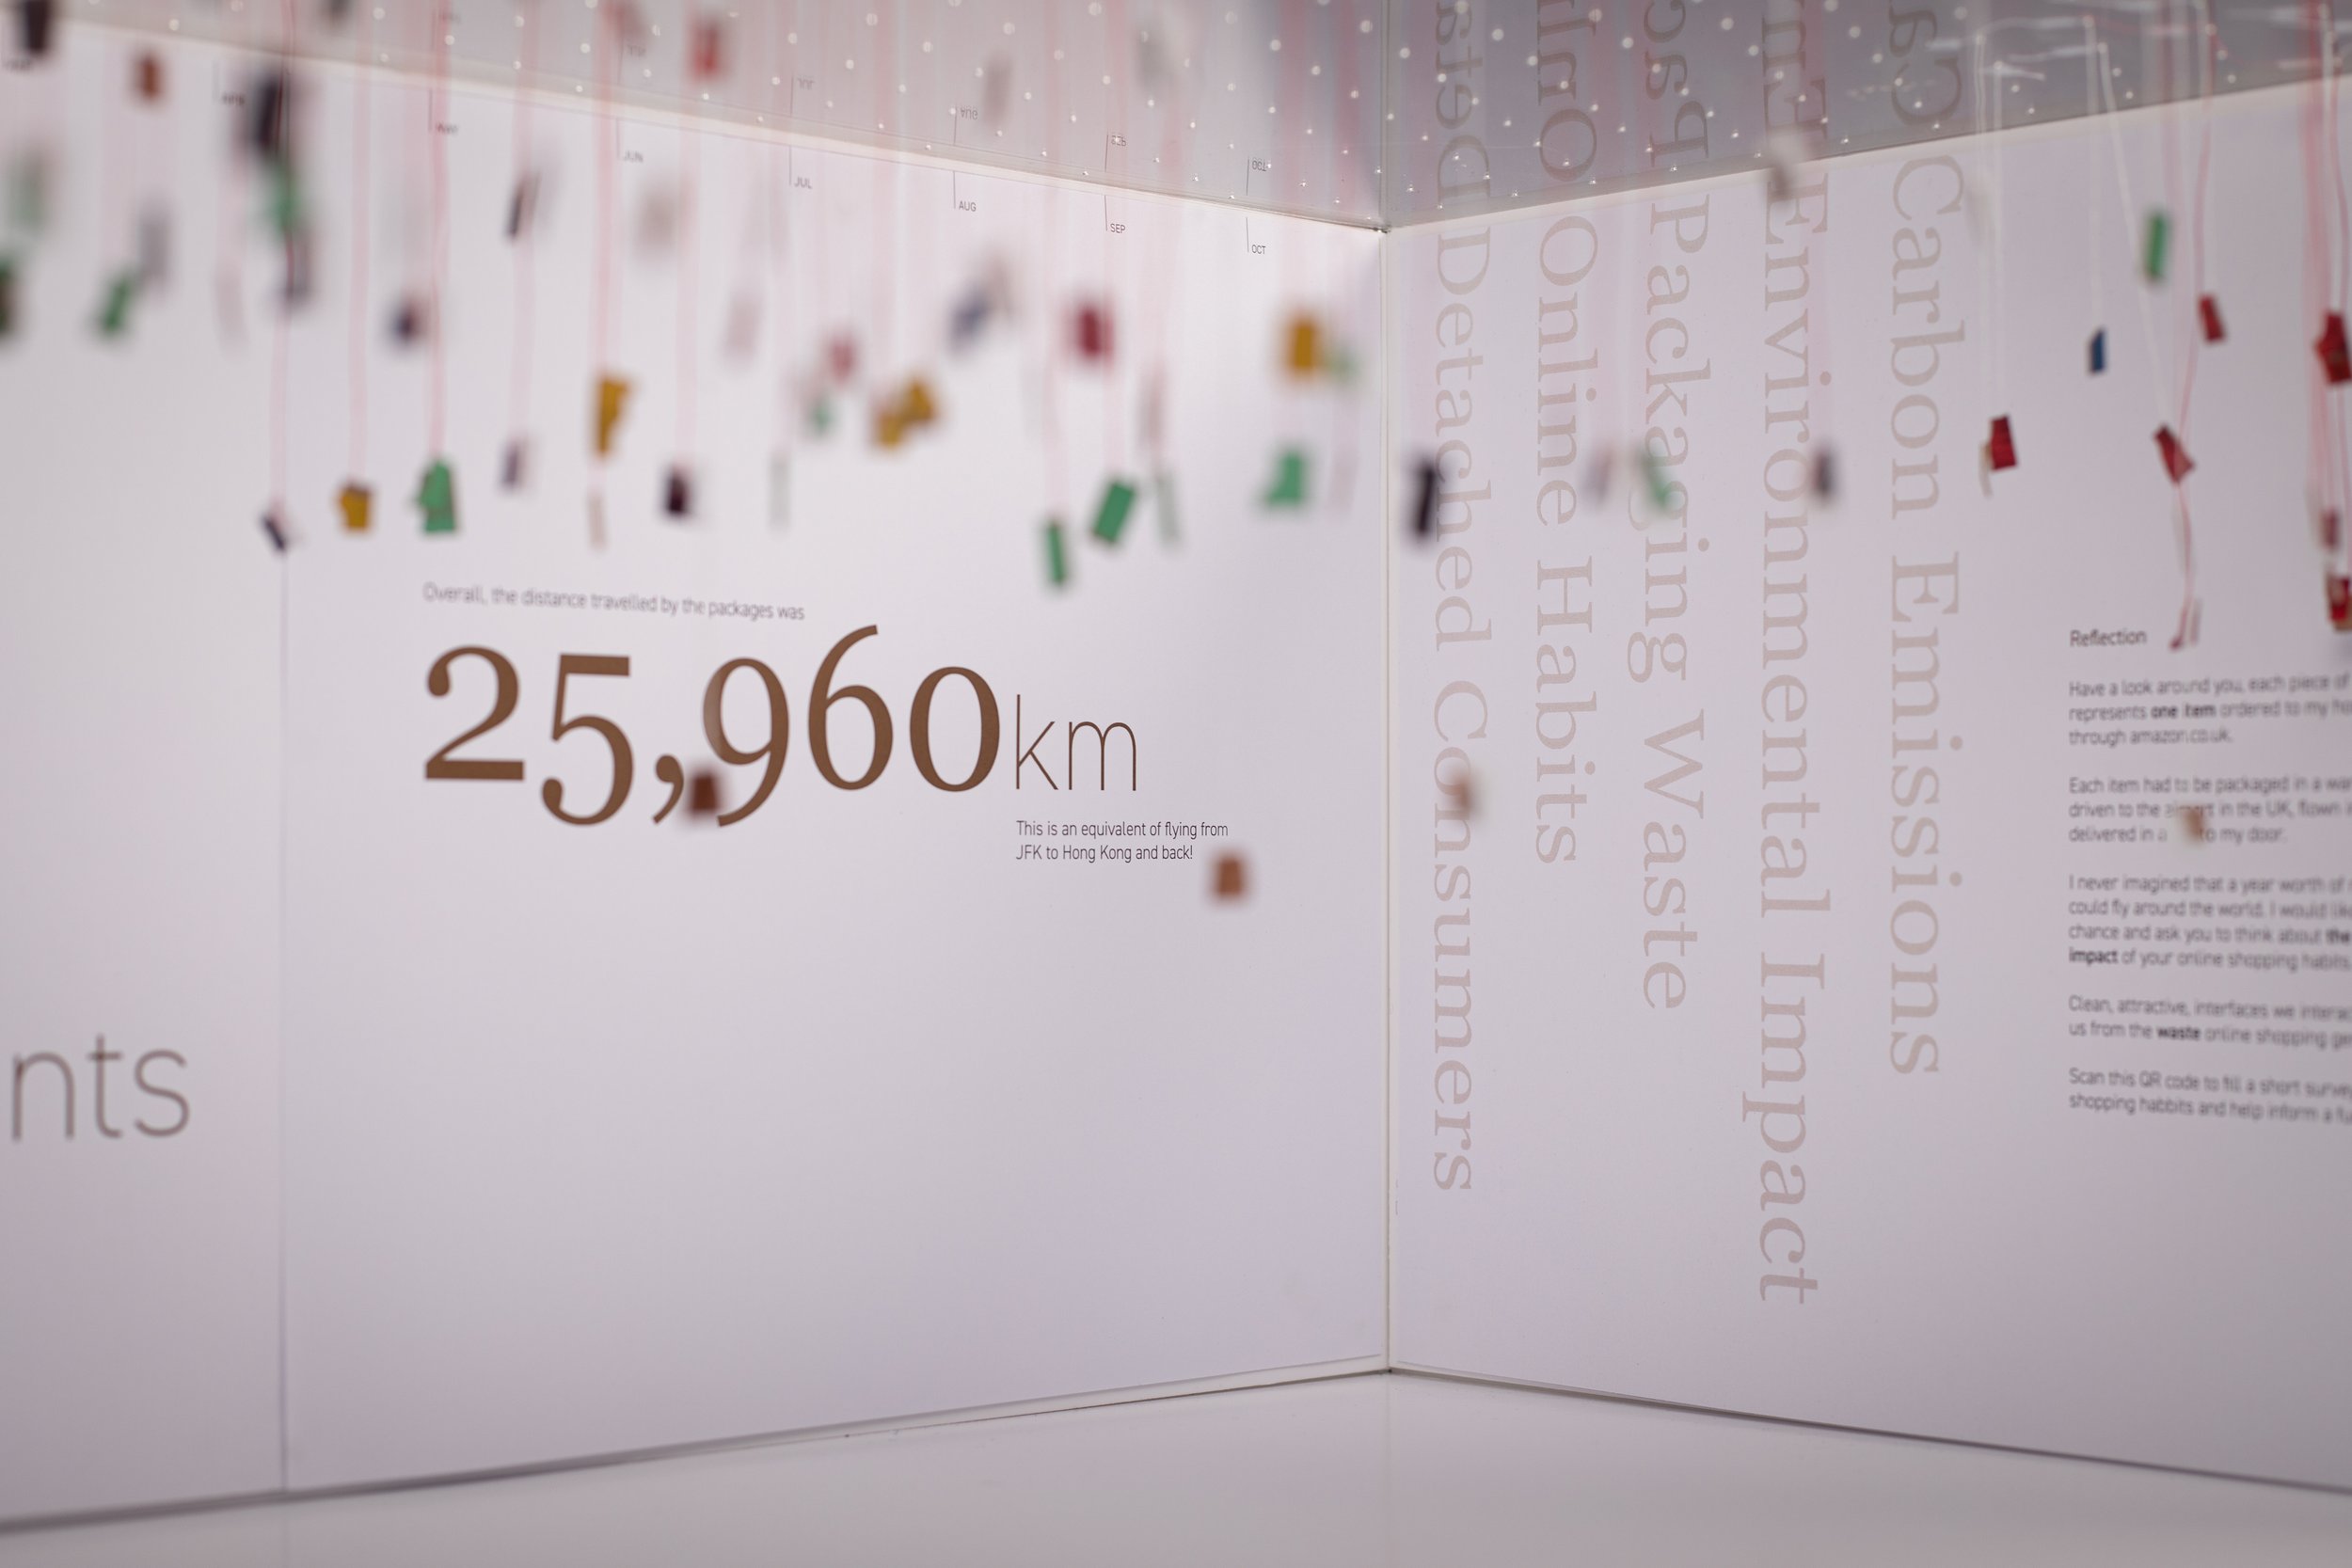
Main points from conclusion are pulled out on the right wall and "hang" from the ceiling

Human figure model to showcase the scale
Reflection
Things that worked great
I came up with a strong and impactful story
Data was easy to collect (scrolling through my Amazon order history)
I was comfortable working with datasets in long form
I used Tableau software to aid my understanding of data that I collected.
What didn’t go so well
I did not realise how time-consuming fabricating and hanging 144 items would be
Exhibition model could be of a higher standard (mounting typographic panels onto foam board was tricky)
I could have used a better scale figure